A Visual Guide to Power BI and Python
for Beginners
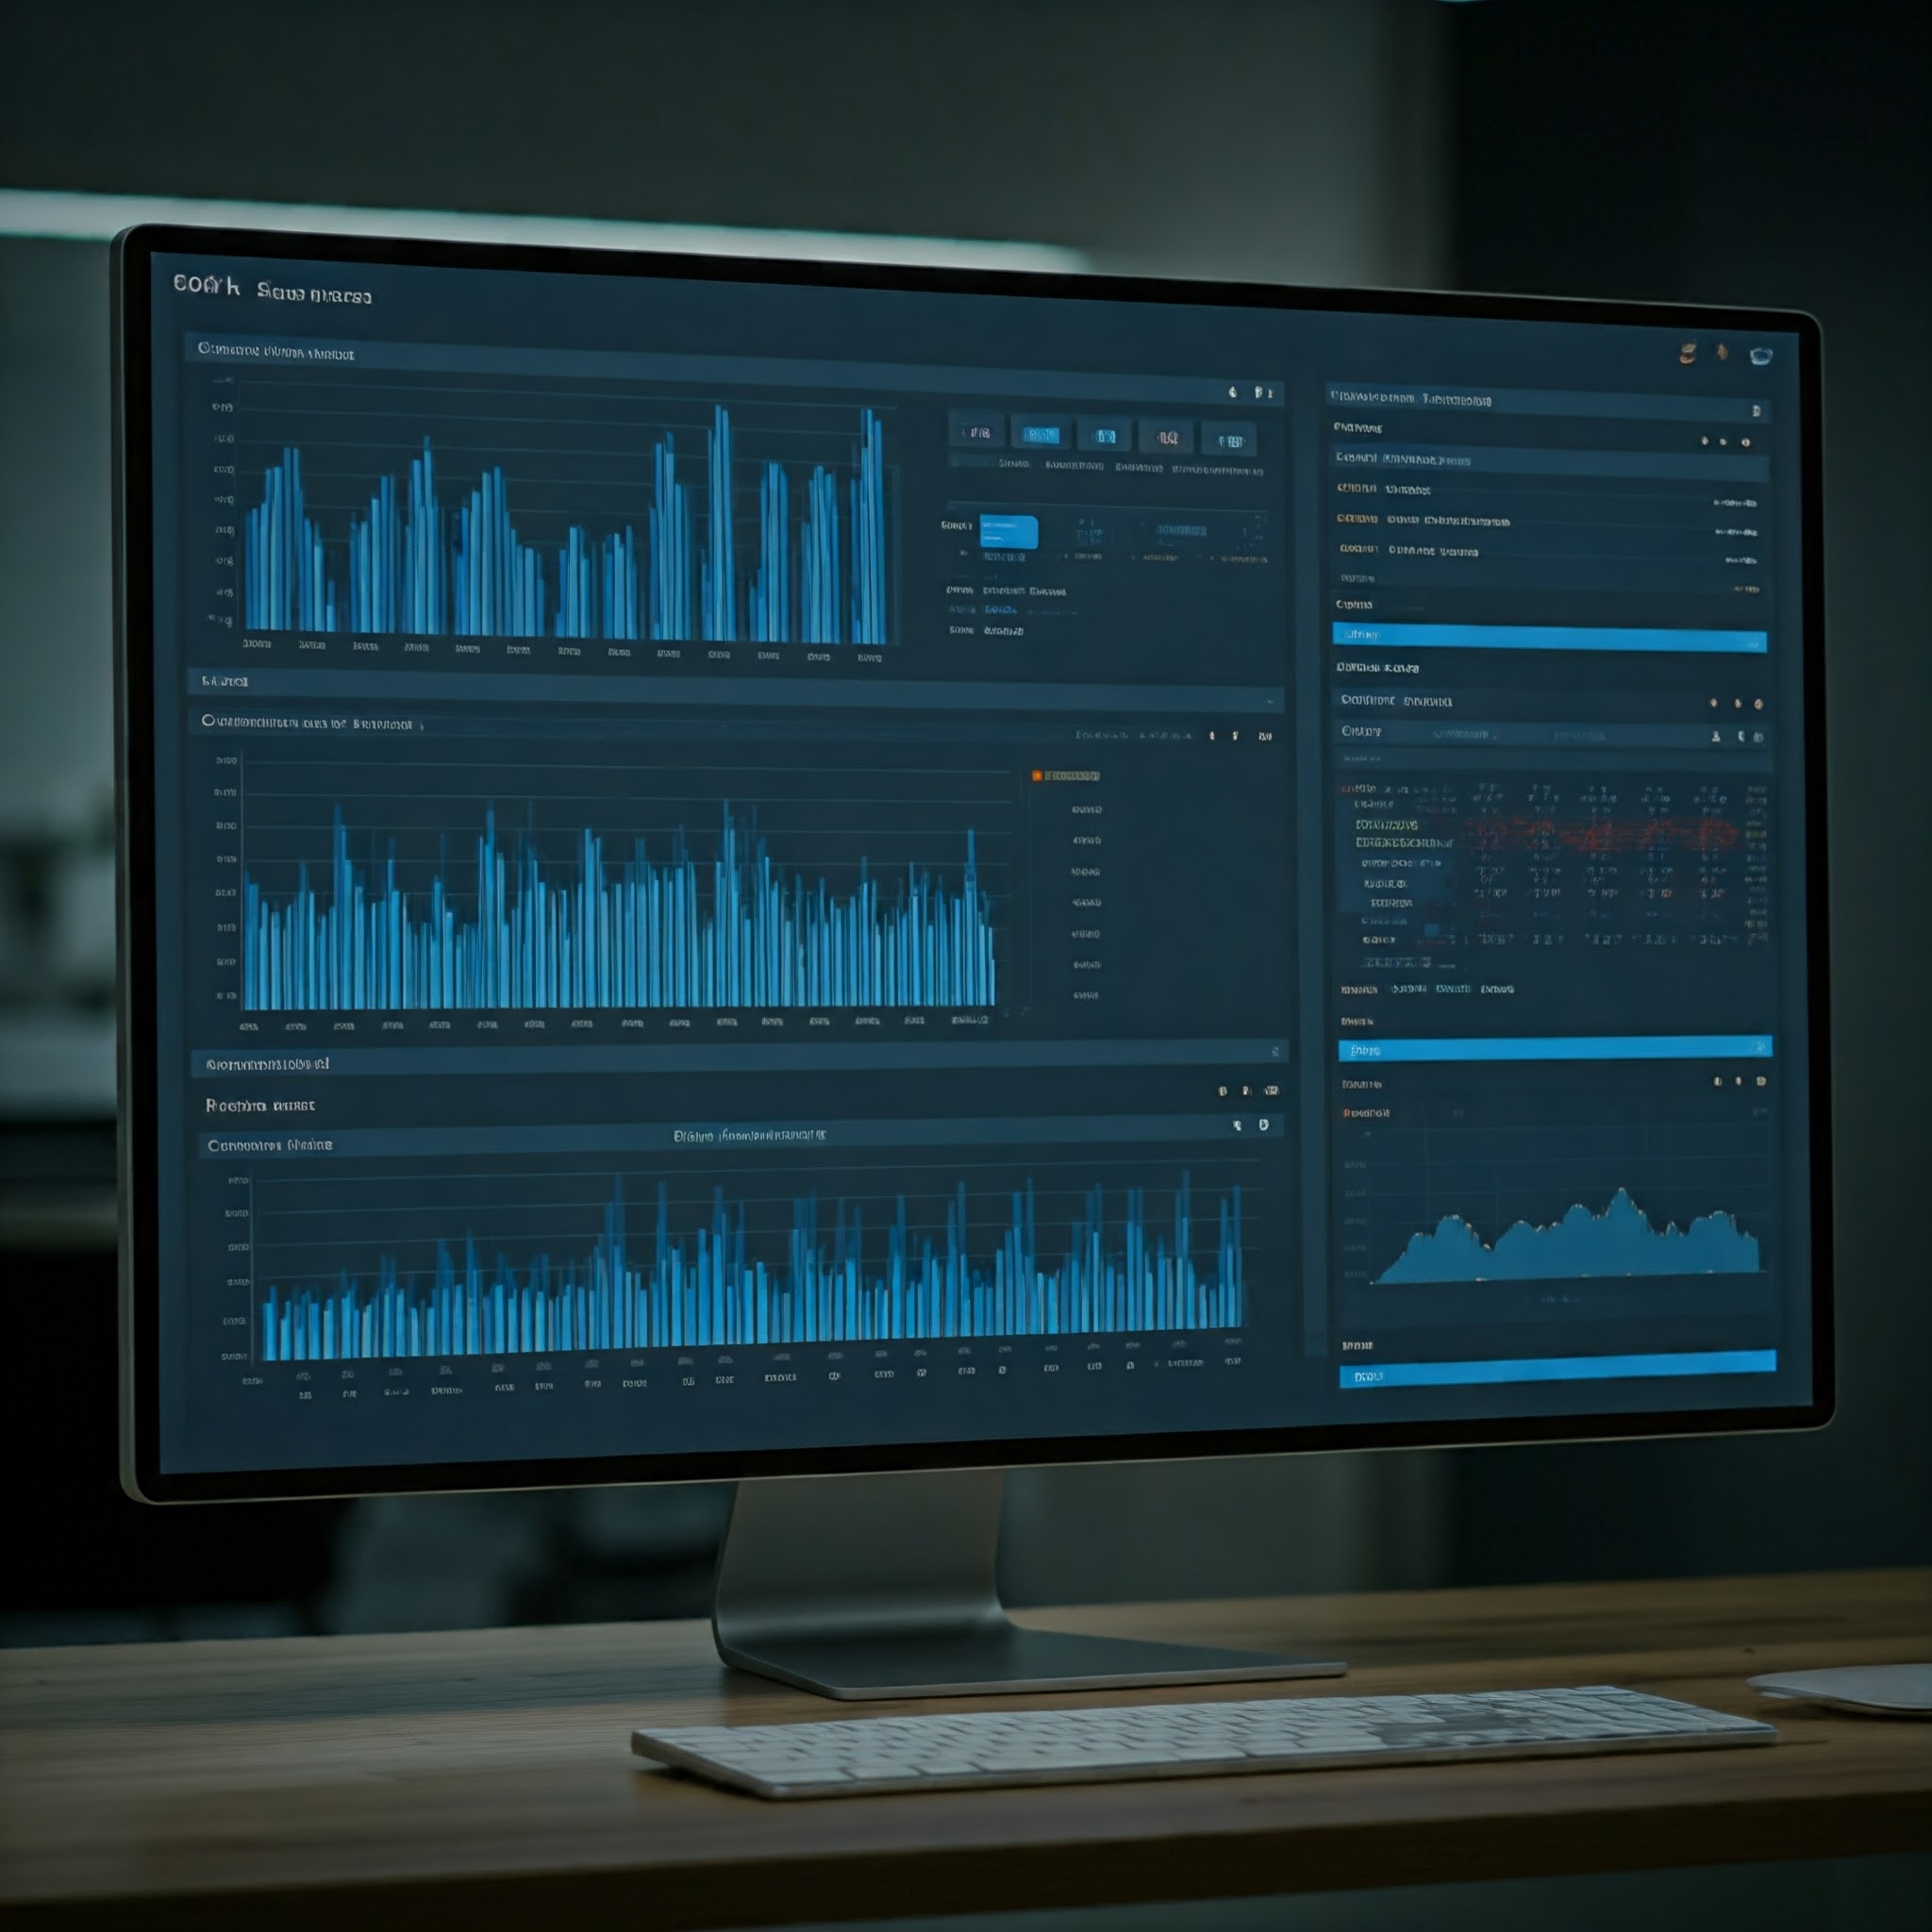
This comprehensive bootcamp offers participants hands-on experience in data analysis, visualization, and automation using Power BI and Python. The course is designed to equip learners with the tools needed to transform raw data into actionable insights, automate workflows, and build interactive dashboards. Whether you’re a beginner or looking to deepen your expertise, this bootcamp will guide you through the essentials, covering both technical and analytical skills.
- Module 1: Introduction to Data Analytics
- Overview of Data Analytics and Visualization Concepts
- Understanding the Role of Power BI and Python in Data Analytics
- Setting up Power BI and Python Development Environments
- Module 2: Power BI Fundamentals
- Module 3: Advanced Power BI Techniques
- Module 4: Python Basics and Data Manipulation
- Module 5: Data Analysis with Python
- Module 6: Integrating Power BI with Python
- Module 7: Capstone Project
Introduction to Power BI Interface
Data Loading and Cleaning with Power Query
Creating Data Models and Relationships
Building Basic Visualizations (Tables, Charts, Maps)
Interactive Reports and Dashboards
DAX (Data Analysis Expressions) for Data Modeling
Creating KPIs and Custom Measures
Advanced Filters, Drilldowns, and Tooltips
Publishing Reports to Power BI Service
Power BI Gateway Setup for Real-Time Data
Introduction to Python Programming
Data Structures (Lists, Dictionaries, DataFrames)
Working with Libraries (Pandas, NumPy, Matplotlib)
Reading and Writing Data Files (CSV, Excel, JSON)
Data Cleaning and Transformation
Exploratory Data Analysis (EDA) using Pandas
Data Visualization with Matplotlib and Seaborn
Statistical Analysis and Summary Reporting
Automating Workflows with Python Scripts
Embedding Python Scripts in Power BI Visuals
Leveraging Python for Data Cleaning within Power BI
Advanced Analytics in Power BI using Python (Forecasting, Regression)
Publishing Python-Enhanced Reports to Power BI Service
Identifying a problem statement and gathering data.
Performing data analysis using Python.
Integrating Python for additional analysis or automation within the Power BI report.

